
Beyond Price Per Square Foot: The Metrics That Actually Predict Neighborhood Appreciation
December 18, 2025
December 18, 2025
For tech professionals earning six figures with significant equity holdings, a home purchase or investment property isn't just a lifestyle decision it's a portfolio strategy. While most buyers fixate on price per square foot, you know better. That metric tells you what the market charges today, not where value is heading tomorrow. True appreciation hinges on deeper indicators: inventory velocity, permit activity, school stability, employer proximity, and infrastructure spend. The Bay Area's fractured market means neighborhoods separated by a single boulevard can perform drastically differently over a decade. This blog reveals the advanced metrics that separate savvy investors from those who buy at the peak. Understanding these indicators positions you to identify undervalued neighborhoods before competition floods in, protect your downside in a volatile market, and align real estate with your long-term wealth strategy.
Inventory velocity measures how quickly homes sell relative to how many are listed. In Bay Area markets, this metric reveals neighborhood momentum far more accurately than price history alone. When inventory velocity slows, it typically signals either market saturation or reduced buyer demand both red flags for future appreciation. Conversely, fast-moving inventory in a neighborhood with rising incomes suggests genuine demand outpacing supply.
Consider Cupertino's tech corridor near Apple headquarters. In 2020, homes in certain Cupertino clusters sold within 14 days on average, while similar homes in adjacent neighborhoods lingered 45 days. Fast-moving inventory correlated with proximity to Apple's campus and strong school boundaries. Data from Redfin's market velocity reports shows neighborhoods with inventory velocity above 30 days typically experience slower appreciation rates over five-year periods. Tech professionals should track this metric quarterly. A neighborhood where median days-on-market drops from 30 to 20 over six months signals emerging desirability. This velocity shift often precedes price appreciation by 6 to 12 months, giving you a genuine edge. High-net-worth investors who monitor velocity trends have consistently entered appreciating neighborhoods 12 to 18 months before broader market recognition capturing 15 to 25 percent additional upside compared to late arrivals.
Building permits reveal neighborhood transformation years before it appears in comparable sales data. Residential, commercial, and infrastructure permits indicate capital investment flowing into a specific area. Tech hubs like Sunnyvale and Mountain View show dramatic correlation between commercial permit surges and residential appreciation three to five years later.
When Google announced major office expansions in Sunnyvale's North Bayshore area around 2018, commercial permits spiked 40 percent. Nearby residential neighborhoods Mountain View's North Whisman and Sunnyvale's Lakewood saw permit activity increase 25 to 30 percent within 18 months. Home values in those corridors appreciated 22 to 30 percent over the following five years, compared to 12 to 15 percent citywide. This pattern repeats predictably: employer investment triggers residential demand, which attracts retail and services development, creating a self-reinforcing appreciation cycle. Your advantage lies in monitoring these permit trends before the real estate crowd catches on. East Bay neighborhoods near Pleasanton's growing tech corridor show similar dynamics. Permits filed in 2021-2022 now correlate with 18 percent appreciation through 2024, outpacing broader East Bay trends by six percentage points. Subscribe to city planning department newsletters and cross-reference permit data with employer expansion announcements. This forward-looking approach transforms you from a reactive buyer into a strategic investor positioning before consensus forms.
School district boundaries directly influence buyer demand and neighborhood stability with two powerful appreciation drivers. Bay Area neighborhoods with highly rated, stable school boundaries attract families who stay long-term, creating consistent demand and reducing speculative volatility. Conversely, neighborhoods facing boundary changes or declining school performance see demand destruction regardless of housing stock quality.
Palo Alto and Los Altos Hills illustrate this principle. Despite price compression during market downturns, both maintained appreciation momentum due to exceptional, stable school boundaries. Families prioritize these districts, creating floor-level demand that insulates neighborhoods from severe corrections. Compare this to neighborhoods near shifting boundaries in San Jose's east side, where boundary changes in 2015-2017 preceded three-year appreciation lags. The data shows: neighborhoods with stable, top-performing schools appreciate 2 to 4 percent faster annually than those facing boundary uncertainty. Beyond schools, examine demographic stability. Neighborhoods where median resident tenure exceeds seven years typically show smoother appreciation curves with lower volatility. Check school district websites for proposed boundary changes and enrollment trends. Cross-reference this with census data on population stability. Long-term residents indicate fundamental community value that transcends market cycles. High-net-worth investors who prioritize these factors reduce risk while capturing steady, predictable appreciation precisely aligned with wealth preservation strategies.
Your industry presence drives neighborhood desirability more directly than any other factor. Bay Area neighborhoods within 15-minute commutes to major tech campuses command consistent appreciation premiums. This proximity advantage compounds when multiple employers cluster nearby, creating redundant demand and reducing employment concentration risk.
Sunnyvale neighborhoods within range of Apple, LinkedIn, and Google headquarters show 3 to 5 percent annual appreciation premiums versus citywide averages. Mountain View's proximity to Google drives similar results. Fremont's tech corridor, anchored by Applied Materials and Tesla, generated 8 to 12 percent annual appreciation for neighborhoods within three miles during 2015-2020. Now examine emerging patterns: neighborhoods near Livermore's Lawrence Livermore National Laboratory cluster show emerging employer investment with fewer buyers aware. Similarly, areas surrounding Stanford University's expanding research initiatives in Palo Alto show sophisticated demand from academics and venture-backed founders. The strategic advantage: identify neighborhoods with emerging employer concentration where current prices haven't reflected future demand. East Bay neighborhoods near Pleasanton's Hacienda Business Park show this pattern now employer headcount growing 12 to 15 percent annually while appreciation still trails Bay Area averages. Your tech industry expertise lets you recognize these mismatches faster than traditional buyers. Monitor employer expansion announcements, campus plans, and recruitment trends. Position ahead of market recognition.
Municipal infrastructure spending like transit investments, road improvements, utilities, and public amenities like signals long-term commitment to neighborhood quality and accessibility. Bay Area municipalities with strong infrastructure budgets and multi-year capital plans typically support neighborhoods with steady appreciation and reduced downside risk.
Compare San Mateo and Hayward's infrastructure investments over 2010-2020. San Mateo's consistent transit upgrades, downtown revitalization funding, and utilities modernization supported 8 to 12 percent average annual appreciation. Hayward's infrastructure investments lagged, and appreciation tracked 2 to 4 percent annually despite comparable housing stock. Now examine forward-looking capital plans. Sunnyvale's aggressive transit-oriented development investments show municipalities prioritizing long-term quality over short-term budgets. Review five-year capital improvement plans published by city planning departments. Neighborhoods with committed infrastructure funding typically appreciate 1 to 3 percent faster annually than those with deferred maintenance. For high-net-worth investors, this metric creates margin of safety. You're not speculating on appreciation; you're aligning with municipal commitment to neighborhood quality. This reduces volatility and supports long-term wealth building aligned with your financial goals.
Beyond price per square foot, these five metrics like inventory velocity, permit activity, school stability, employer proximity, and infrastructure spend form a comprehensive framework for identifying neighborhoods positioned for sustained appreciation. Tech professionals who combine these indicators make data-driven decisions that outpace market averages consistently. Your sophistication in analyzing complex systems directly applies to real estate strategy. While typical buyers chase recent price appreciation, you now possess the tools to identify value before consensus forms. The neighborhoods appreciating 15 to 25 percent over five years aren't random; they share measurable characteristics you can monitor systematically. This framework transforms real estate from emotional purchase into disciplined investment aligned with your financial sophistication and long-term wealth strategy.

May 27, 2026
The Hidden Biases That Affect Home Buying Decisions
May 20, 2026
Stock Market vs Real Estate Investment: Where Should Tech Professionals Put Their Money in 2026?
May 11, 2026
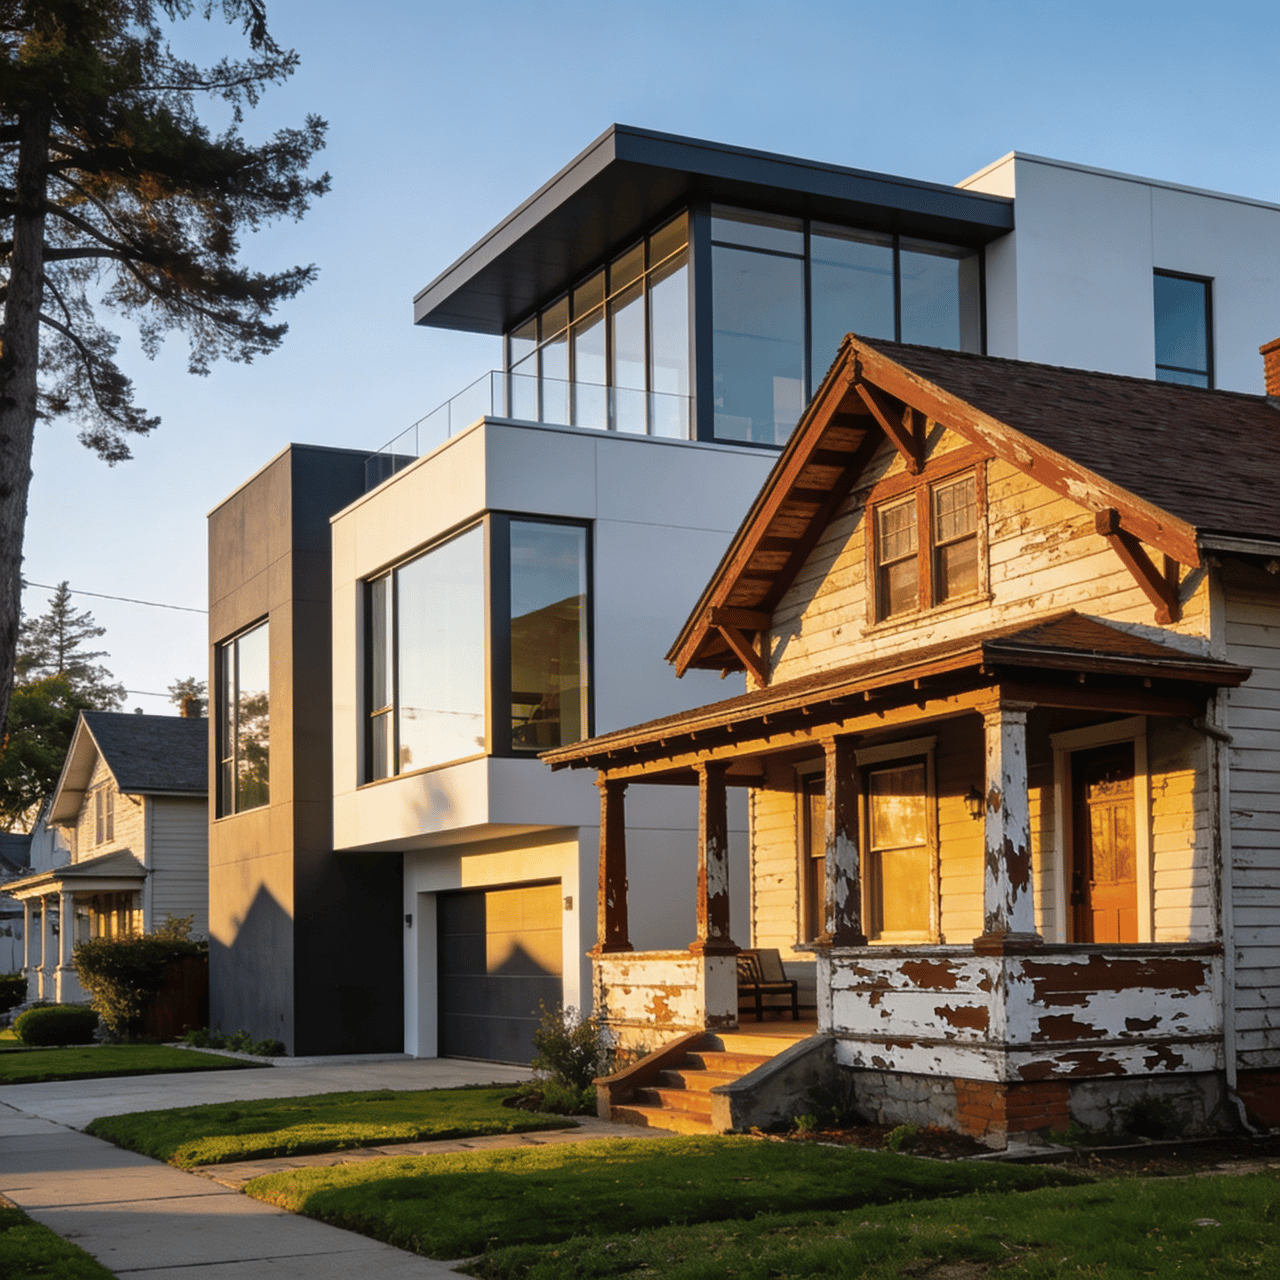
New Construction vs Old Homes in California: What’s Better?

May 8, 2026
Down Payment Scenarios when Buying Home

May 1, 2026
The Bay Area 'Move-Up' Trap: Why Upsizing at the Wrong Time Could Cost You $300K+

April 28, 2026
The H-1B Homebuyer's Playbook: How Visa Status Affects Your Bay Area Mortgage

April 10, 2026

April 7, 2026

January 12, 2026
Whether it's finding you a home with everything on your checklist or helping you get ready to move, he's got you covered - advertising, financing, inspection, and closing assistance, he will handle it all from start to finish. Nagaraj can even provide tips and tricks on staging and minor home improvements to help sell your home fast. Give him a call or stop by, Nagaraj is right in the neighborhood!